


For most Lakewood High School students, Tuesdays are a forgettable blur of classes and cafeteria food — a bridge between the start of the week and the distant hope of the weekend. But for Noam Rossiter, a freshman at Lakewood High School, Tuesday is the most important day of the week. It is a day of data, human connection and the 1-to-7 scale.
Since Jan. 20, Rossiter has been the architect of a self-directed social project about students ranking their Tuesdays. What began as a simple idea has grown into a data set tracking the collective ratings of his peers. Using Google Sheets and a genuine interest in those around him, Rossiter is showing that even the most “random” day of the week has more of a story than it may seem.
The reason for the “Random” Tuesday
Rossiter’s reasoning for focusing on Tuesdays is philosophical. While Mondays are often seen as “bad” and Fridays as “good,” Tuesdays fall in a more neutral space.
“Tuesdays seem the most random to people,” Rossiter said.
To him, Tuesday represents a more accurate baseline of a person’s week, not influenced by the stress of a new beginning or the excitement of the weekend.
This idea is shared by other students. “I think Tuesday is the best day because other days, like Friday, people are more excited than normal,” said Luke Boland.
Rossiter’s method is simple: He approaches students during classes and asks them to “Rate your Tuesday on a scale of 1-to-7.”
The scale itself is intentional. Rossiter said, “[A 1-to-10 scale] does not have a true middle, and when asking about a 1-10 scale, people actually mean 0-10,” noting confusion between the endpoints. Influenced by his humanities teacher, Rossiter chose a 1-to-7 scale to provide a clearer middle ground.
Influenced by his humanities teacher, Rossiter settled on the 1-to-7 scale as the Goldilocks of metrics—offering enough variety for a middle ground without losing precision. “I think this helps build his critical skills for his future to be quite excellent,” noted Lakewood teacher Kathy Gabriel.
A Year of Data and Discovery
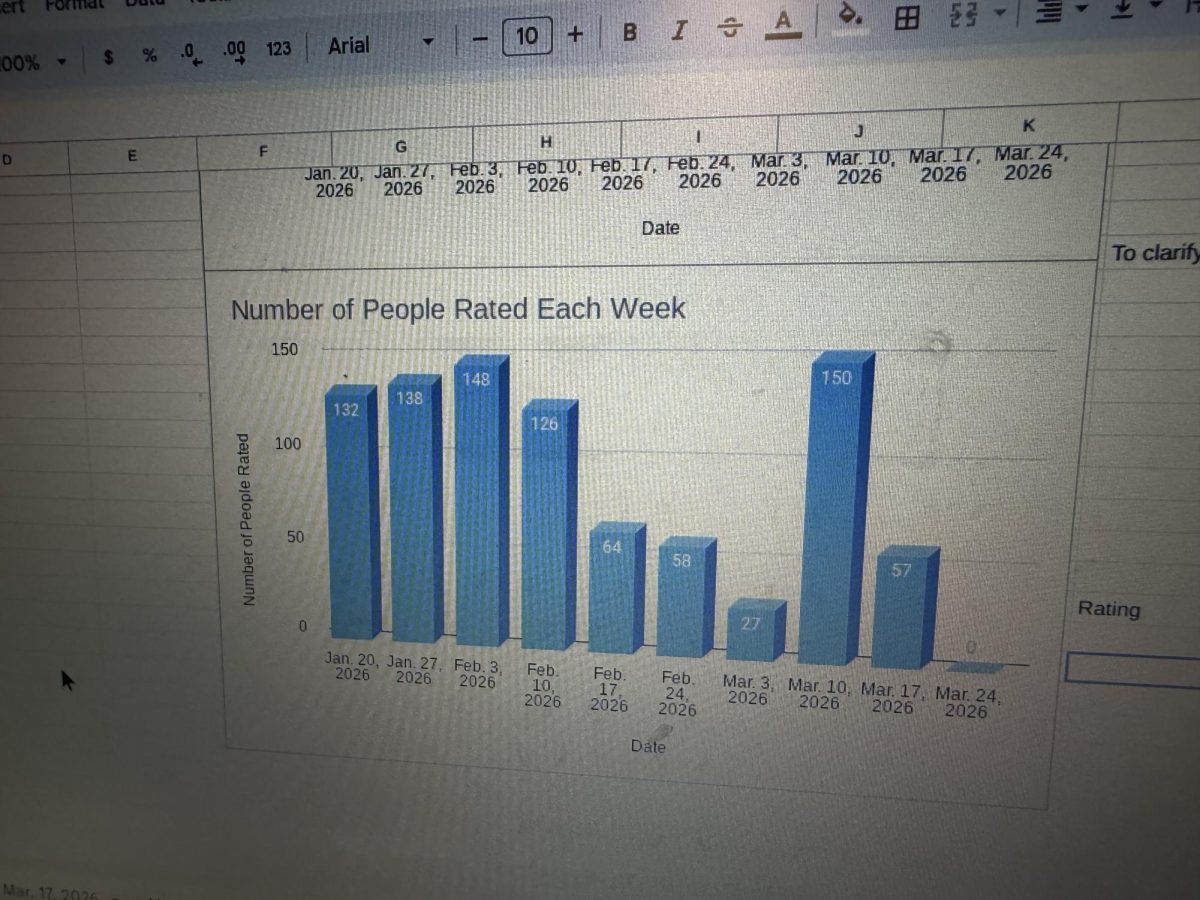
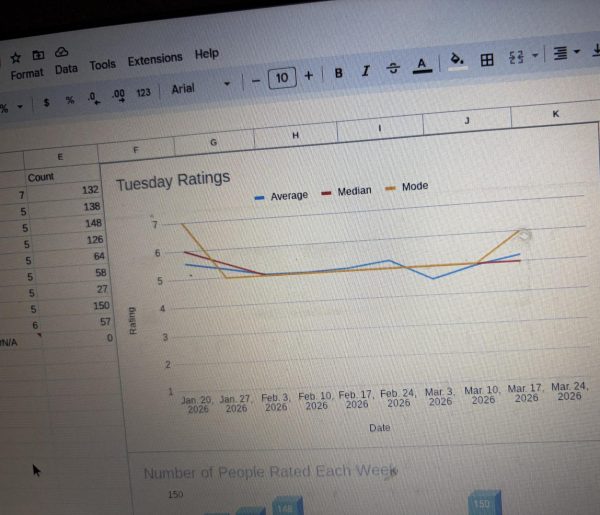
Rossiter is not just collecting responses — he is building a digital record. His Google Sheets include averages, percentiles and trend lines. He tracks ratings alongside the number of students surveyed each week.
The project has not been without challenges. Rossiter said some lower-response periods were caused by his “own commitments and lack of preparation.” Balancing schoolwork with a self-driven project can be difficult.
Despite these challenges, the results have been detailed. His data includes graphs showing average ratings and the percentage of students giving specific scores. He can identify trends and compare how ratings shift over time.
The Human Element
Beyond the graphs, Rossiter’s project is about connection. In an era of mediated digital interaction, the survey requires face-to-face interaction, encouraging students to reflect on their day. “It makes me rethink what I did that day and how it went, so I can rate it,” explains Luka Trempe.
Rossiter plans to continue the project through his senior year, creating a four-year study of student experiences at Lakewood High School. He said he hopes to refine the process by improving organization, protecting anonymity and finding better ways to present the data.
By the time he graduates, Rossiter aims to have a record of how students experienced the “randomness” of their school weeks. For now, he continues to focus on each Tuesday — one rating at a time.